

Don’t read too much into harbingers of stock market doom and gloom
Sometimes, it pays—literally—to look beyond what’s “obvious” to everyone else.
Case in point: An inverted yield curve (when yields on short-term fixed-income securities are higher than yields on longer-term bonds) is often considered to be one of the clearest, most compelling signs that an economic recession is imminent.
But you wouldn’t know that from recent history.
In July 2022, the yield curve inverted—the 2-year U.S. Treasury note yield exceeded that of a 10-year U.S. Treasury— and has stayed that way ever since. At more than 500 consecutive days, the current inversion is the longest in history (see the chart).
Record Curve Inversion
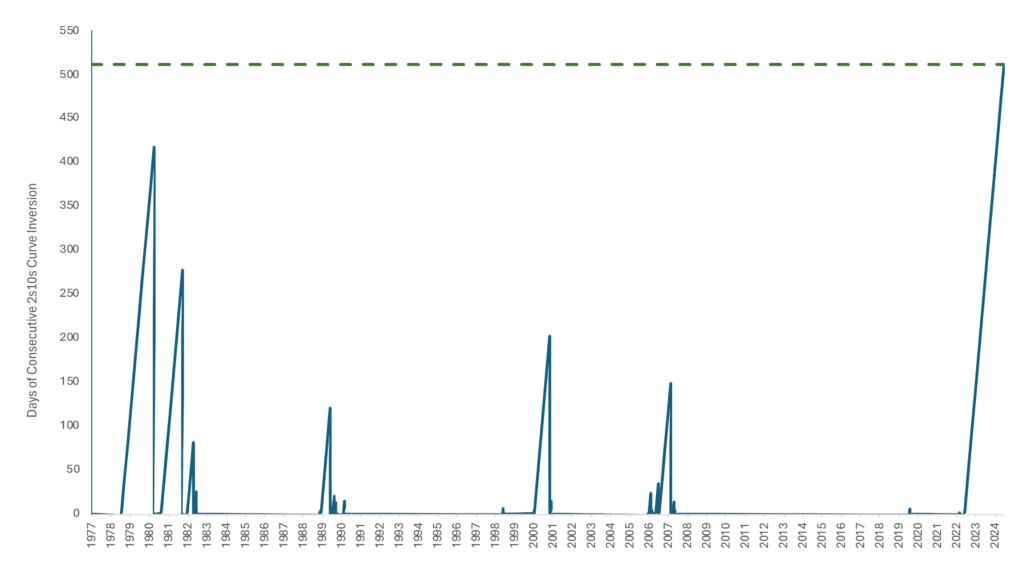
Source: Bloomberg, calculations by Horizon Investments, as of July 24, 2024.
Despite this unprecedented inversion, the economy has not just avoided a recession over the past two years—it’s remained remarkably strong. Here’s how various asset classes have performed since July 5, 2022*:
- S&P 500: +50%
- Nasdaq 100: +71%
- Foreign Stocks (MSCI ACWI ex USA): +30%
- High Yield Bonds (Bloomberg US Corporate High Yield): +22%
- Treasury Bills (Bloomberg U.S. Treasury Bills): +10%
- Core Bonds (Bloomberg U.S. Aggregate): +2%
The upshot: Investors who fled to the “safety” of cash following the “obvious” recession signal two years ago would likely have missed out on sizable gains. And those who loaded up on bonds would likely have almost nothing to show for their efforts.
Ultimately, we see value in using a multi-disciplined investment process to assess opportunities and risks rather than trying to navigate the markets using any single indicator of economic health. For example, our process has allowed us to see that the current business cycle has some profound differences from previous ones—and to implement strategies that might not have been obvious to others.
* total returns rounded to the nearest 1%, as of 7/23/24. Past performance is not indicative of future results. Indices are unmanaged and do not have fees or expense charges, both of which would lower returns. It is not possible to invest directly in an unmanaged index.
The S&P 500 or Standard & Poor’s 500 Index is a market-capitalization-weighted index of the 500 largest U.S. publicly traded companies. The Nasdaq 100 Index is a stock index of the 100 largest companies by modified market capitalization trading on Nasdaq exchanges. The MSCI ACWI ex USA Index captures large and mid-cap representation across 22 of 23 Developed Markets (DM) countries (excluding the US) and 24 Emerging Markets (EM) countries. The Bloomberg U.S. Corporate High Yield Bond Index measures the USD-denominated, high yield, fixed-rate corporate bond market. The Bloomberg U.S. Treasury Index measures US dollar-denominated, fixed-rate, nominal debt issued by the U.S. Treasury. The Bloomberg U.S. Aggregate Bond Index is a broad-based benchmark that measures the investment grade, U.S. dollar-denominated, fixed-rate taxable bond market, including Treasuries, governmentrelated and corporate securities, mortgage-backed securities, asset-backed securities and collateralized mortgage-backed securities. References to indices, or other measures of relative market performance over a specified period of time are provided for informational purposes only. Reference to an index does not imply that any account will achieve returns, volatility, or other results similar to that index. The composition of an index may not reflect the manner in which a portfolio is constructed in relation to expected or achieved returns, portfolio guidelines, restrictions, sectors, correlations, concentrations, volatility, or tracking error targets, all of which are subject to change. Information obtained from third party sources is believed reliable but has not been vetted by the firm or its personnel.
This commentary is written by Horizon Investments’ asset management team. Past performance is not indicative of future results. Nothing contained herein should be construed as an offer to sell or the solicitation of an offer to buy any security. This report does not attempt to examine all the facts and circumstances that may be relevant to any company, industry, or security mentioned herein. We are not soliciting any action based on this document. It is for the general information of clients of Horizon Investments, LLC (“Horizon”). This document does not constitute a personal recommendation or take into account the particular investment objectives, financial situations, or needs of individual clients. Before acting on any analysis, advice, or recommendation in this document, clients should consider whether the security in question is suitable for their particular circumstances and, if necessary, seek professional advice. Investors may realize losses on any investments. Asset allocation cannot eliminate the risk of fluctuating prices and uncertain returns. All investing involves the risk of loss.
The investments recommended by Horizon Investments are not guaranteed. There can be economic times when all investments are unfavorable and depreciate in value. Clients may lose money. This commentary is based on public information that we consider reliable, but we do not represent that it is accurate or complete, and it should not be relied on as such. The opinions expressed herein are our opinions as of the date of this document. These opinions may not be reflected in all of our strategies. We do not intend to and will not endeavor to update the information discussed in this document. No part of this document may be (i) copied, photocopied, or duplicated in any form by any means or (ii) redistributed without Horizon’s prior written consent. Forward-looking statements cannot be guaranteed. Other disclosure information is available at www.horizoninvestments.com.
Horizon Investments and the Horizon H are registered trademarks of Horizon Investments, LLC
©2024 Horizon Investments, LLC.