

OVERVIEW
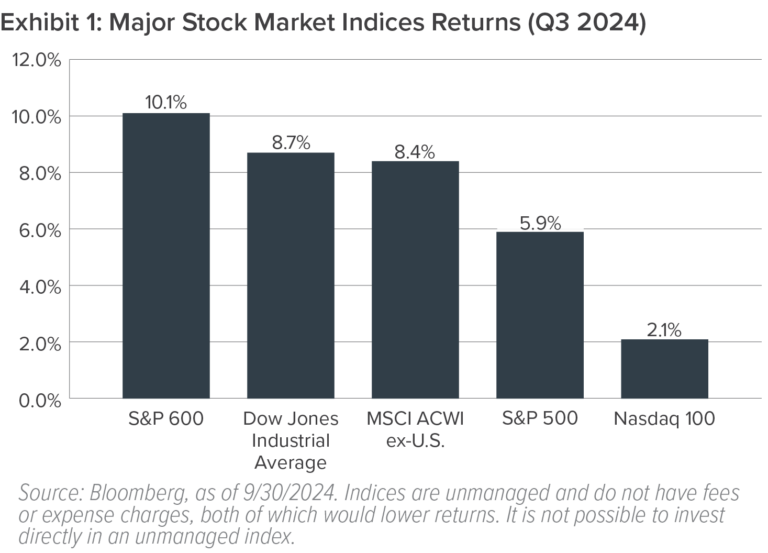
Stocks posted another quarter of positive returns — despite some significant volatility along the way—with several equity market indices recording a string of record highs. For the third quarter:
- The S&P 600 index of small company stocks rose 10.1% — its best quarterly return since the fourth quarter of 2023.
- The Dow Jones Industrial Average returned 8.7% – also its best quarterly return since the fourth quarter of 2023.
- Foreign shares also rose, with the MSCI ACWI ex-U.S. index of developed and emerging international markets up 8.4%.
- The S&P 500 index gained 5.9% and booked its best year-to-date return through September (+21%) since 1997.
- The Nasdaq 100 index returned 2.1%.
Investors faced various challenges during the quarter, most notably a global sell-off in early August sparked by fears of a recession. Ultimately, these hurdles didn’t appear to matter as the Federal Reserve Board signaled it would cut short-term interest rates for the first time in four years. Investors cheered the Fed’s decision in September to lower the federal funds rate by 50 basis points, which came after a steady series of rate hikes aimed at taming inflation.
Stock market gains broadened out during the third quarter. The small group of tech stocks known as the Magnificent 7, which had essentially driven most of the market’s return for much of the year, took a backseat to a wider range of sectors and asset classes. Value stocks, small-caps, utilities, financial services, real estate, and other market areas delivered enough strong gains to outpace the technology sector.
International stocks also delivered positive returns, outperforming U.S. equities for the first time since the fourth quarter of 2022. In particular, Chinese stocks (up 23.5% during the quarter) rallied late in the quarter after the Chinese government announced stimulus measures to boost the country’s economy. Europe (7.3%), Japan (5.7%), and emerging markets as a group (8.7%) posted smaller gains.
In the fixed-income market, bond prices rose (and bond yields fell) on the growing prospects of rate cuts and an economic soft landing. Corporate bonds, in particular, gained ground, with the more volatile and rate-sensitive high-yield sector posting strong results for the quarter. The yield on the 10-year U.S. Treasury note fell to 3.75% by the end of September, down from 4.48% at the start of July.
FAMILIAR TERRITORY
Over the past four years, investors have confronted an economic and fiscal environment that has been both surprising and confusing in many ways. The pandemic—and the path out of it—saw an extended period of wild swings in the labor market, massive government expenditures, strong but disjointed consumer spending patterns, and the highest inflation in decades.
As we noted at the start of 2024, “the economic conditions we’ve seen since the pandemic began in 2020 are largely unlike any that most investors have ever experienced.” In that environment, many traditional investment signals and leading economic indicators simply didn’t work.
The upshot: We believe most of the factors that drive the business and economic cycles have now moderated and that we have—in many fundamental ways—returned to “normal.” For example:
1. INFLATION
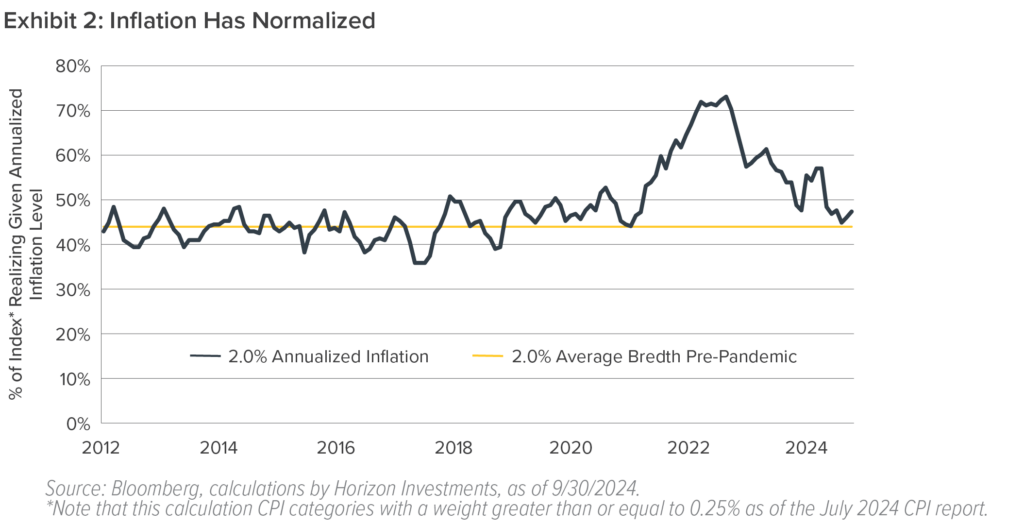
After spiking to a high of 9.1% in the summer of 2022, the annual rate of inflation has generally traveled lower. Today, a broad swath of prices for goods and services has normalized: As seen in Exhibit 2, the inflation rate for most categories in the Consumer Price Index has fallen back to its pre-pandemic, long-term average of around 2%. In other words, the current breadth of inflation is essentially normal based on history.
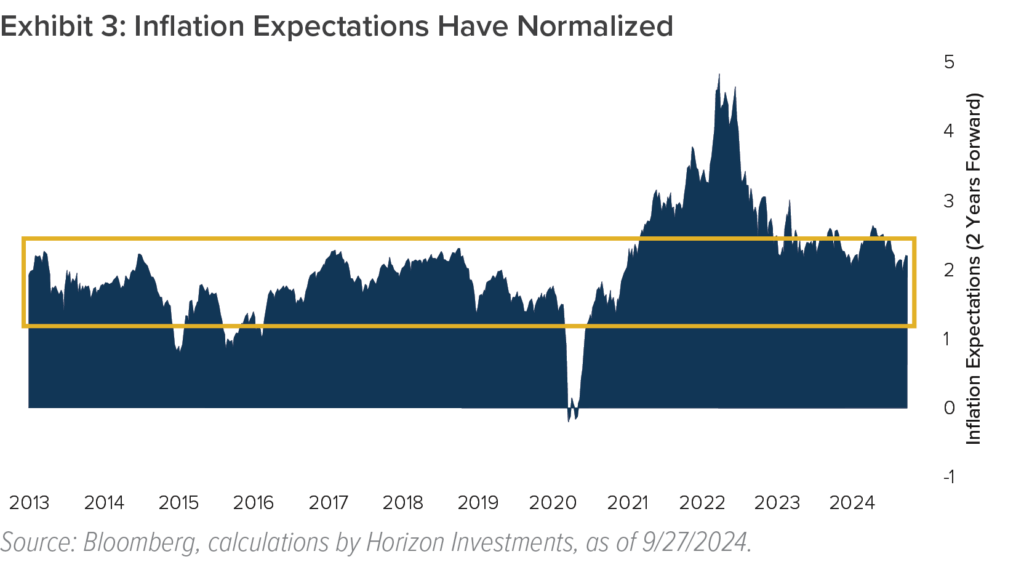
Just as important: Investors’ expectations for future inflation over the next two years have reverted back to their historically narrow range—after swinging wildly back and forth for several years, as seen in Exhibit 3.
2. CONSUMERS’ SPENDING POWER
Despite seemingly endless media headlines about alarming debt levels and credit card delinquencies, the facts reveal that U.S. consumers’ financial health today is well within the normal range—and, in some cases, above average. Given that consumer spending accounts for approximately two-thirds of the economy’s growth rate, we see this as excellent news.
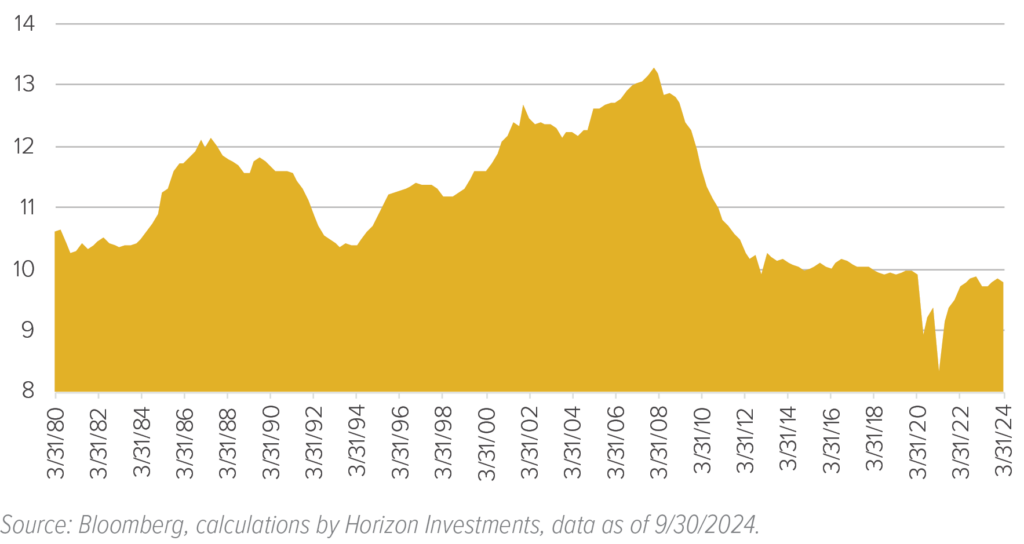
One of the best ways to assess consumers’ ability to meet financial obligations is the debt service ratio, which compares their quarterly debt payments to disposable income. It fell precipitously in 2020 before surging in 2021 and 2022, as seen in Exhibit 4. Look out longer term, however, and it’s clear that this ratio remains below the levels seen during the past 15 years and far lower than what consumers experienced for most of the past four decades.
Exhibit 4: U.S. Household Debt Service Ratios is Normal – Low, Event
U.S. Consumer Debt Service Ratio Since 1980
One key driver of consumers’ financial health: U.S. workers’ real incomes— after accounting for inflation—continue to rise across all income levels (see Exhibit 5).

The upshot: U.S. consumers are employed, they’re in healthy financial shape, and their earnings are growing faster than inflation—all of which give them continued robust spending power.
3. INTEREST RATES AND THE FED
Steadily lower inflation that’s nearing the Federal Reserve Board’s target of 2%, coupled with strong consumer spending power, have empowered the Fed to start the process of normalizing its monetary policy by lowering the federal funds rate. In the process, the yield curve shifted from being inverted (short-term yields were higher than long-term yields) back to its normal, uninverted structure in which longer-term bonds yield more than short-term securities.
Notably, the Federal Reserve Bank of Atlanta President commented during the quarter that he envisions the Fed “normalizing monetary policy sooner than I thought would be appropriate even a few months ago.”
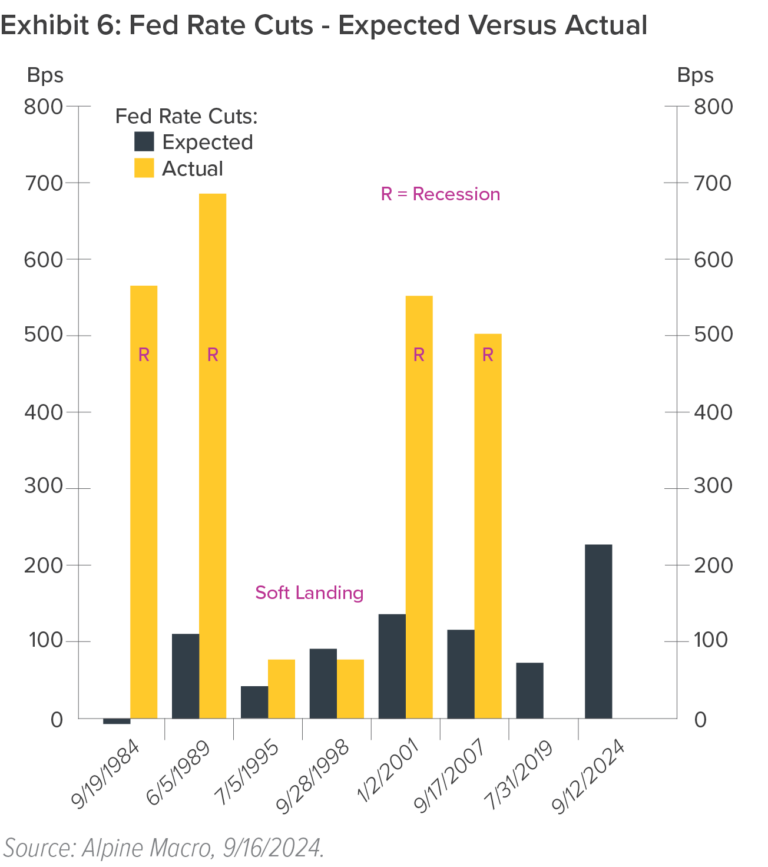
How much the Fed will ultimately cut, of course, depends on the incoming data. But given the relatively high probability of a soft landing scenario—in which inflation stays contained while the labor market remains healthy — it’s likely that the federal funds rate will fall to around 3% by the time the Fed ends its current easing cycle.
To see why, consider Exhibit 6. It shows that during non-recessionary periods when the Fed is expected to cut rates—which describes the period we’re in today—the market’s expectations for those cuts tend to match up well with what the Fed ends up doing.
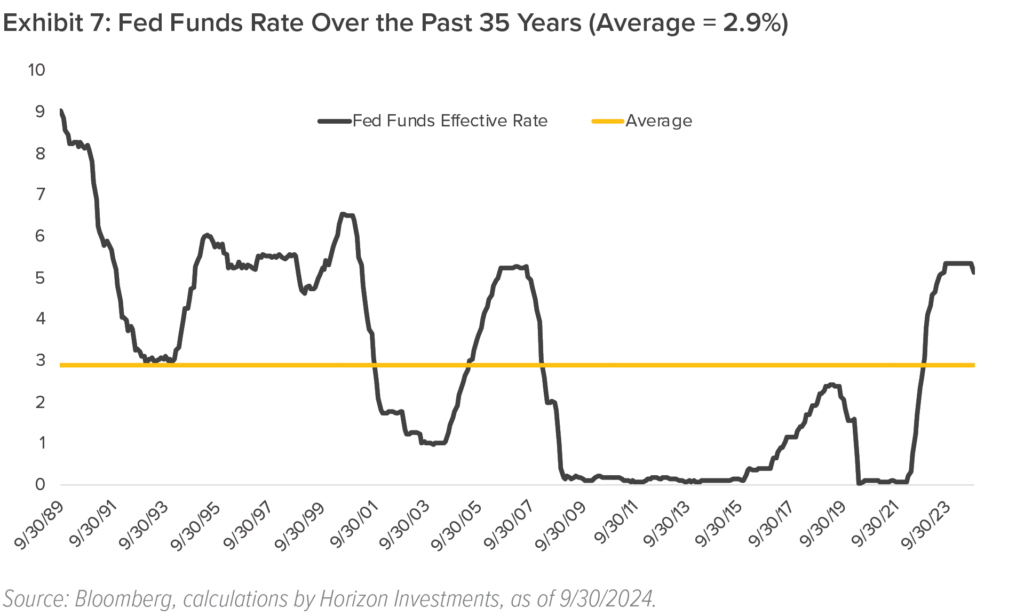
Currently, the market would like to see the Fed funds rate fall by roughly 200 basis points from its current target of 4.75% – 5.00%. That decline would suggest an endpoint of around 3%—essentially the long-term average of the fed funds rate over the past 35 years (see Exhibit 7).
KEEPING A CLOSE EYE ON NORMAL
Going into the fourth quarter, we will watch how these recent shifts back toward normalcy develop. For example, as noted, the recent rise in the overall debt service ratio of U.S. households has merely brought that ratio back to its long-term historical range. But if that ratio continues on its current trajectory rather than plateauing, it could signal that consumers are finally feeling significant financial stress that will cut into their spending power.
Additionally, investors may experience sizable swings during October—which historically is one of the most volatile months of the year for major equity market indices. Anxiety about the
upcoming election and continuing conflicts in the Middle East could push fourth-quarter volatility even higher than usual.
That said, the market’s performance during the fourth quarter of the calendar year is generally strong despite bouts of volatility. What’s more, the prospects for inflation, the labor market, interest rates, consumer spending, and corporate profits remain strong—all of which suggest that stocks from a broad range of asset classes and market sectors have what they require to move higher from their current levels.
Past performance is not indicative of future results. The commentary in this report is not a complete analysis of every material fact with respect to any company, industry, or security. The opinions expressed here are not investment recommendations but rather opinions that reflect the judgment of Horizon as of the date of the report and are subject to change without notice. Opinions referenced are as of the date of publication and may not necessarily come to pass. Forward-looking statements cannot be guaranteed.
The Nasdaq-100 is a stock market index made up of equity securities issued by 100 of the largest non-financial companies listed on the Nasdaq stock exchange. The S&P 500 or Standard & Poor’s 500 Index is a market-capitalization-weighted index of the 500 largest U.S. publicly traded companies. The MSCI ACWI ex-U.S. captures large and mid-cap representation across 22 Developed Markets and 24 Emerging Markets countries and excludes the U.S. The Dow Jones Industrial Average is a stock market index of 30 prominent companies listed on stock exchanges in the United States.The S&P SmallCap 600 Index (S&P 600) is a stock market index that tracks the small-cap segment of the US equity market. References to indices, or other measures of relative market performance over a specified period of time are provided for informational purposes only.
Reference to an index does not imply that any account will achieve returns, volatility or other results similar to that index. The composition of an index may not reflect the manner in which a portfolio is constructed in relation to expected or achieved returns, portfolio guidelines, restrictions, sectors, correlations, concentrations, volatility or tracking error targets, all of which are subject to change. Indices are unmanaged and do not have fees or expense charges, both of which would lower returns. Individuals cannot invest directly in any index.
We do not intend and will not endeavor to provide notice if and when our opinions or actions change. Horizon Investments is not soliciting any action based on this document. This document does not constitute an offer to sell or a solicitation of an offer to buy any security or product and may not be relied upon in connection with the purchase or sale of any security or device. The investments recommended by Horizon Investments are not guaranteed. There can be economic times when all investments are unfavorable and depreciate in value. Clients may lose money.
Information has been obtained from sources considered to be reliable, but accuracy and completeness cannot be guaranteed.
Horizon Investments is an investment advisor registered with the U.S. Securities and Exchange Commission. Registration does not imply a certain level of skill or training. More information about Horizon’s investment advisory services can be found in our Form ADV Part 2, which is available upon request.
Horizon Investments, and the Horizon H are registered trademarks of Horizon Investments.
© 2024 Horizon Investments, LLC.
NOT A DEPOSIT | NOT FDIC INSURED | MAY LOSE VALUE | NOT BANK GUARANTEED | NOT INSURED BY ANY FEDERAL GOVERNMENT AGENCY
