Search
Close this search box.

Quarterly Report | The Road Ahead: Three Trends We’re Watching


Overview

Overall, stocks delivered another quarter of strong gains during the three-month period ending June 28, 2024. For the quarter:

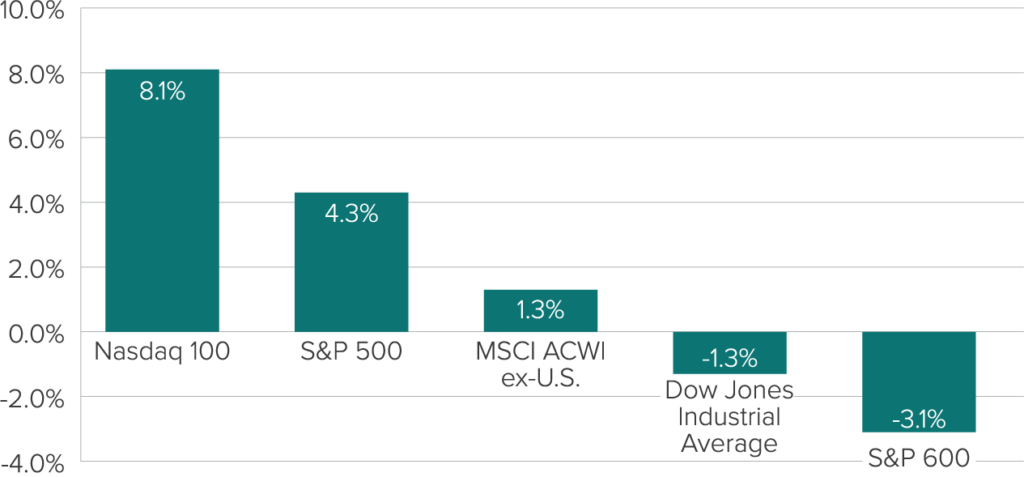
  • The Nasdaq 100 returned 8.1%.
  • The S&P 500 index returned 4.3%.
  • Foreign shares also rose, with the MSCI ACWI ex-U.S. index of developed and emerging international markets up 1.3%.

Two exceptions: The Dow Jones Industrial Average was down 1.3%, while the S&P 600 index of small-company stocks fell 3.1%.

Exhibit 1: Major Stock Market Indices Returns (Q2 2024)


Source: Bloomberg, as of 6/30/2024. Indices are unmanaged and do not have fees or expense charges, both of which would lower returns. It is not possible to invest directly in an unmanaged index.

The broad U.S. equity market’s gains during the second quarter were generated primarily by a relatively small group of mega-cap stocks from the technology sector. This led to the second-best quarter of growth stock outperformance (9.6%) relative to value shares (-2.1%)  in the past 30 years (topped only by the first quarter of 2020).

Additionally, the S&P 500 index was up 15.3% year-to-date through June 28, 2024.

International stocks were mixed. Overall, emerging markets outperformed developed markets as the outlook for China improved. European markets underperformed largely due to political concerns in France, while Japan underperformed due in part to a weaker yen.

In the fixed income market, signs of stronger-than-expected inflation pushed Treasury yields higher (and bond prices lower) at various points. Over the course of the quarter, it became clear that relatively sticky inflation would prompt the Federal Reserve Board to keep interest rates at current levels for longer than investors had initially anticipated. Ultimately, however, bond yields finished the quarter roughly where they began it.


Key Themes Going Forward

We are focused on a few themes and trends that we believe will be particularly important going into the third quarter of 2024:

1. Artificial Intelligence (AI) May Drive the Next Productivity Boom

AI technology’s explosive growth has boosted tech stocks (does Nvidia ring a bell?) to massive valuations. Despite the attention AI tech companies are receiving, the most exciting aspect of this technology is its potential to impact businesses in virtually all industries—and, in doing so, influence the broader economy.

Let’s consider when Internet- and web-based technologies were emerging in the mid-1990s. As that tech went from being simply “tech cool” to “business cool,” it helped companies across a variety of sectors significantly improve their operations through enhanced capabilities within information technology systems (see Exhibit 2).

Exhibit 2: Thirty Years of Worker Productivity

Source: Bloomberg, as of 5/22/2024

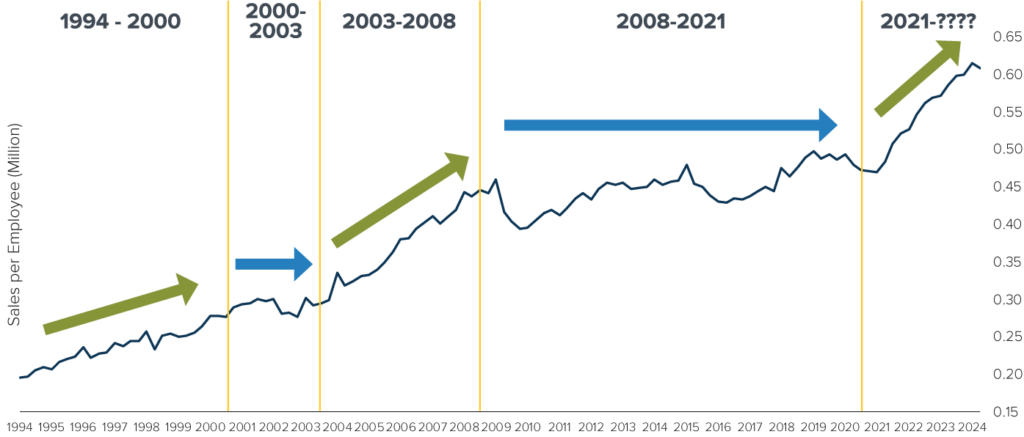
Today, a growing number of companies across industries are recognizing how emerging AI technology tools have the potential to streamline many aspects of their businesses. As this awareness grows, AI could help fuel the next phase of increased worker productivity – potentially resulting in higher corporate profits for numerous sectors and stronger overall economic growth. Indeed, as Exhibit 2 shows, we’ve already seen a spike in average revenue per employee recently. AI may be instrumental in taking it even higher.

2. Consumers Are in Great Shape (No, Really!)

Many surveys evaluating consumer sentiment have indicated a general sense of pessimism among consumers despite the resilience of the economy and the job market. For example, although total debt has hit record levels, consumers’ ability to service that debt—to comfortably make their principal and interest payments—appears to remain strong and well under control.

We can draw this conclusion because American consumers—whose spending accounts for two-thirds of U.S. economic growth—remain in robust financial shape. Consider two facts:

  • Household net worth today is at a near-record high, while household debt is significantly lower than it has been for much of the past 70-plus years (see Exhibit 3).
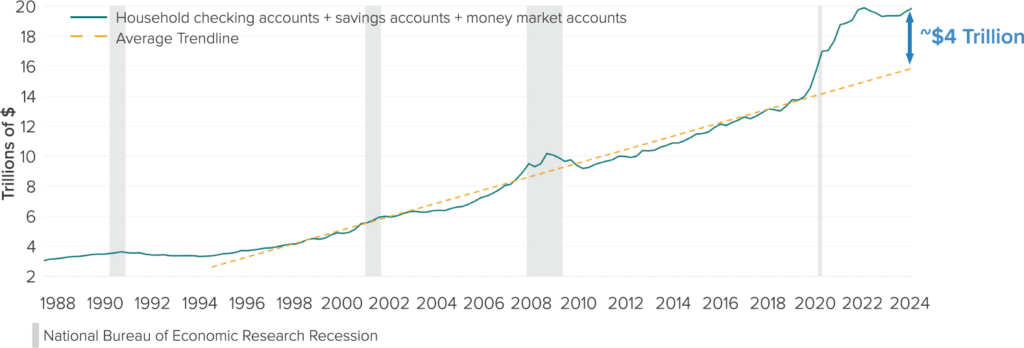
  • Consumers are flush with cash. As seen in Exhibit 4, current balances in consumers’ checking/savings/money market accounts total approximately $20 trillion—roughly $4 trillion more than the long-term trend suggests those balances should be.

The upshot: Consumers still have tremendous amounts of money to put to work in the economy and the financial markets.

Exhibit 3: Household Net Worth is Large; Household Debt is Small

Source: Goldman Sachs, 6/24/2024

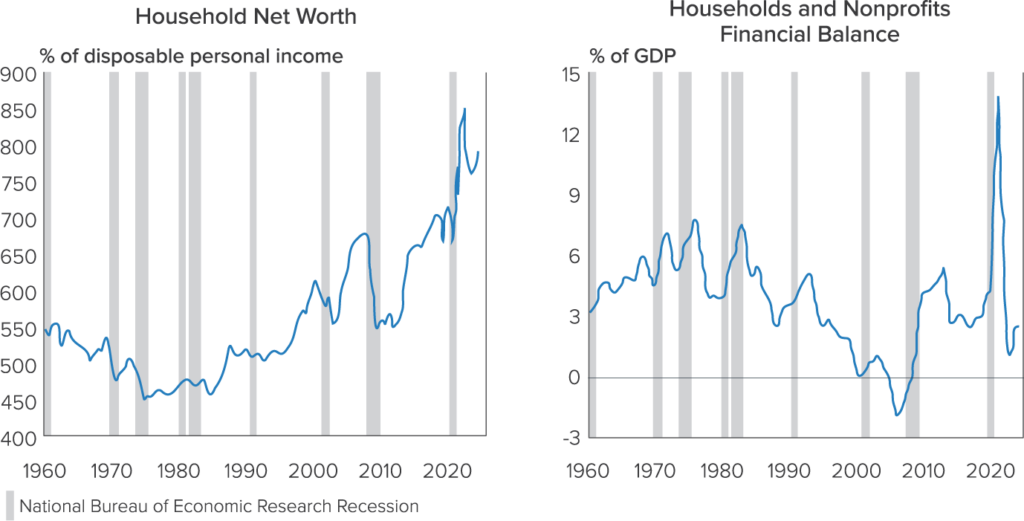
Exhibit 4: Consumer Balances in Checking/Savings/Money Market Accounts

Source: St. Louis Fed, 6/17/2024

However, this begs the obvious question: Given their objectively strong financial position, why do consumers seem so down in the dumps?

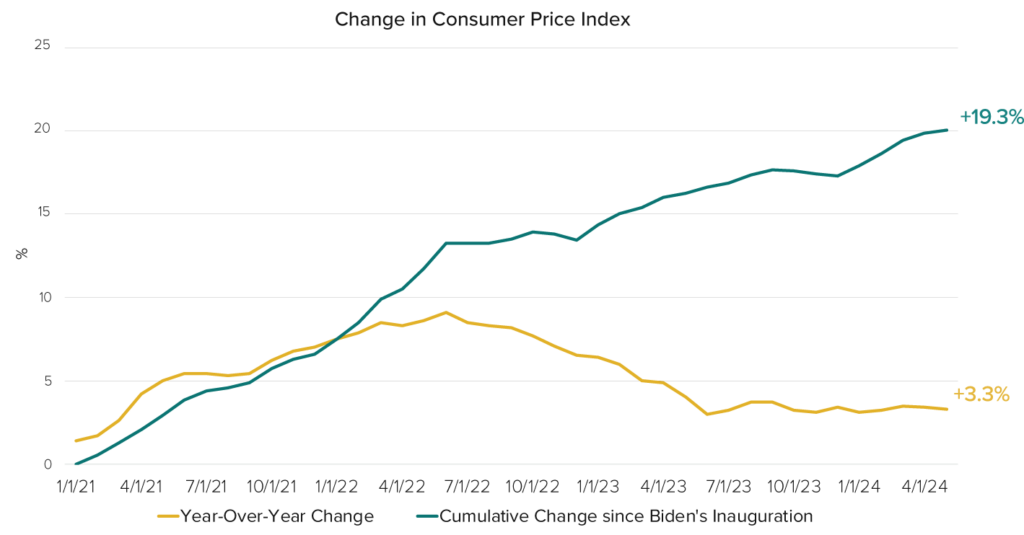
One likely answer can be seen in Exhibit 5, which shows how inflation is being viewed in two very different ways:

  • In the eyes of economists, investors, and the media, inflation has been moderating for some time now. As the yellow line shows, the year-over-year rise in the Consumer Price Index was just 3.3% in May—close to its long-term average and much lower than the 9.1% reading in mid-2022.
  • The general public, however, is focused on the green line in the chart below. When they buy groceries or go out to dinner, they notice that prices are still nearly 20% higher than they were a few years ago. Even if they can easily absorb those higher costs, they’re disheartened by what they see.
Exhibit 5: Inflation – “Good” or “Bad” Depends on Who You Ask

Source: Axios, 5/26/24
“Normal people” = non professional economists
An economist is a professional and practitioner in the social science discipline of economics.
The Consumer Price Index measures the overall change in consumer prices based on a representative basket of goods and services over time.

3. It’s a Good Time to Rethink Portfolio Risk Management

The traditional role of bonds for many investors—an asset class for reducing overall portfolio volatility—is shifting in today’s market, necessitating an evolving approach to risk management.

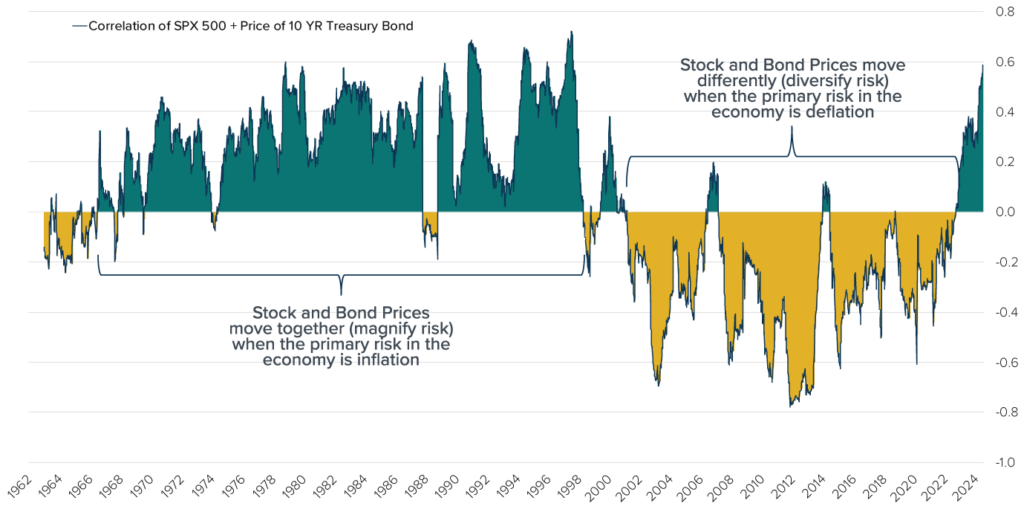
That’s because (as seen in Exhibit 6) stocks and bonds typically enjoy their lowest correlation with each other in environments where inflation is low and the primary risk to the economy is deflation—such as the roughly 20-year period through 2022. During such times, bonds tend to “zig” when stocks “zag,” and vice versa.

Unfortunately, fixed income tends to be less useful as a portfolio diversification/risk reduction tool in an environment like today’s. When the primary economic characteristic is inflation, stock and bond prices tend to become increasingly positively correlated—moving together, as was generally the case from the mid-1960s through the late 1990s rather than apart (see Exhibit 6).

Exhibit 6: Correlation of Stocks and Bonds, Inflationary Versus Deflationary Environments

Source: Bloomberg, calculations by Horizon Investments, 4/30/24
SPX 500= S&P 500 Index The S&P 500 or Standard & Poor’s 500 Index is a market-capitalization-weighted index of the 500 largest U.S. publicly traded companies. It is not possible to invest directly in an index.
10 YR Treasury Bond= U.S. 10 Year Treasury Bond

This makes sense, given that inflation negatively impacts both equities and fixed-income investments. And it means that investors may be better served for the time being by implementing alternative approaches to portfolio risk mitigation—ones that don’t depend entirely on bonds to act as a buffer against stock losses.


Conclusion

Given stocks’ strong showing from January through June, it’s worth noting that there have been nine other instances since 1995 in which the S&P 500 has gained more than 10% during the first half of the year. Historically, here’s what happened next:

  • Stocks rose another 10.6% on average from July through December.
  • Stocks delivered positive second-half returns 100% of the time (9 out of the 9 instances).

No one can predict the future with absolute certainty, of course. But history suggests that six more months of positive stock market performance could be likely. Even more intriguing is that stocks’ first-half return occurred without the Fed rate cuts that had been expected. If the interest rate environment moves lower in the coming months—core Personal Consumption Expenditures (PCE) inflation recently slowed to just 2.6%—it could provide an additional boost to equity prices.

The upshot: Investors concerned about how far the markets have come may also want to remind themselves of how far it may still have to go. That said, given the current environment outlined above, goals-based investors might also want to consider adding equity-based risk mitigation tools to serve as a ballast in the event of market volatility.

Past performance is not indicative of future results. The commentary in this report is not a complete analysis of every material fact with respect to any company, industry, or security. The opinions expressed here are not investment recommendations but rather opinions that reflect the judgment of Horizon as of the date of the report and are subject to change without notice. Opinions referenced are as of the date of publication and may not necessarily come to pass. Forward-looking statements cannot be guaranteed.

The Nasdaq-100 is a stock market index made up of equity securities issued by 100 of the largest non-financial companies listed on the Nasdaq stock exchange. The S&P 500 or Standard & Poor’s 500 Index is a market-capitalization-weighted index of the 500 largest U.S. publicly traded companies. The MSCI ACWI ex-U.S. captures large and mid-cap representation across 22 Developed Markets and 24 Emerging Markets countries and excludes the U.S. The Dow Jones Industrial Average is a stock market index of 30 prominent companies listed on stock exchanges in the United States.The S&P SmallCap 600 Index (S&P 600) is a stock market index that tracks the small-cap segment of the US equity market. References to indices, or other measures of relative market performance over a specified period of time are provided for informational purposes only. Reference to an index does not imply that any account will achieve returns, volatility or other results similar to that index. The composition of an index may not reflect the manner in which a portfolio is constructed in relation to expected or achieved returns, portfolio guidelines, restrictions, sectors, correlations, concentrations, volatility or tracking error targets, all of which are subject to change. Indices are unmanaged and do not have fees or expense charges, both of which would lower returns. Individuals cannot invest directly in any index.

We do not intend and will not endeavor to provide notice if and when our opinions or actions change. Horizon Investments is not soliciting any action based on this document. This document does not constitute an offer to sell or a solicitation of an offer to buy any security or product and may not be relied upon in connection with the purchase or sale of any security or device. The investments recommended by Horizon Investments are not guaranteed. There can be economic times when all investments are unfavorable and depreciate in value. Clients may lose money.

Information has been obtained from sources considered to be reliable, but accuracy and completeness cannot be guaranteed.

Horizon Investments is an investment advisor registered with the U.S. Securities and Exchange Commission. Registration does not imply a certain level of skill or training. More information about Horizon’s investment advisory services can be found in our Form ADV Part 2, which is available upon request.

Horizon Investments, and the Horizon H are registered trademarks of Horizon Investments.

© 2024 Horizon Investments, LLC.

NOT A DEPOSIT | NOT FDIC INSURED | MAY LOSE VALUE | NOT BANK GUARANTEED | NOT INSURED BY ANY FEDERAL GOVERNMENT AGENCY

You are now leaving this website to go to HorizonMutualFunds.com