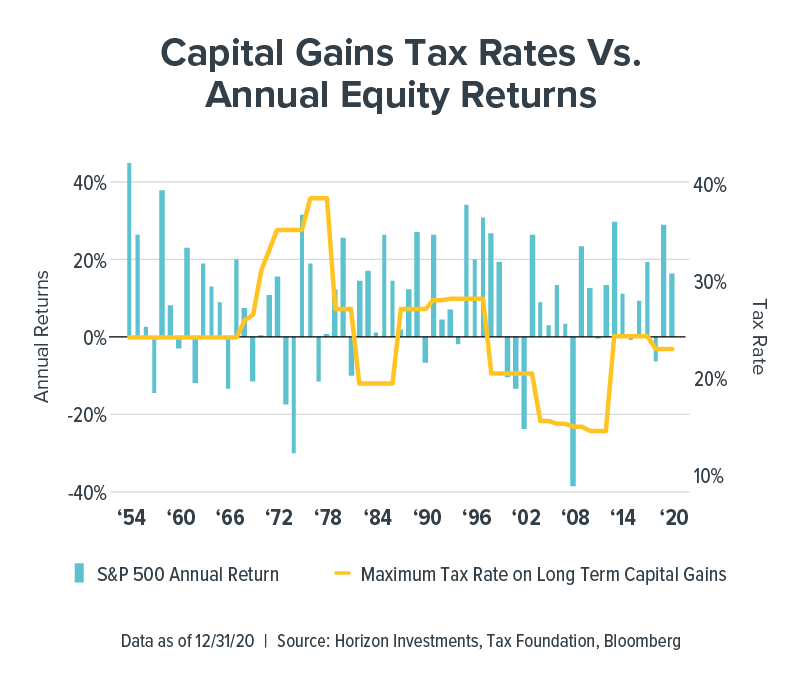
Capital gains tax rates and stock market returns have a lot less in common than you may believe. Their relationship is in the spotlight with the Biden Administration proposing to increase the top capital gains rate by almost 20% to 43.4% for the wealthiest part of the population. While the stunning proposal may just be an opening salvo for negotiations with Congress, if it is enacted it would be the highest tax rate on capital gains in the history of the United States.
The potential for an increase in capital gains tax rates is not a good reason for goals-based investors with long-term financial targets to abandon the potential wealth compounding feature of equity markets.

Surprised by the magnitude of the change and how quickly the administration is moving, investors are worried that the tax push will upset the recent strength in the stock market.
Change without market consequence
But the data we examined doesn’t back up those concerns. Horizon Investments examined yearly returns in the S&P 500 against changes in the top capital gains tax rate since the 1950s, using data from the Tax Foundation. There is no clear pattern between changes in capital gains tax rates and equity returns.
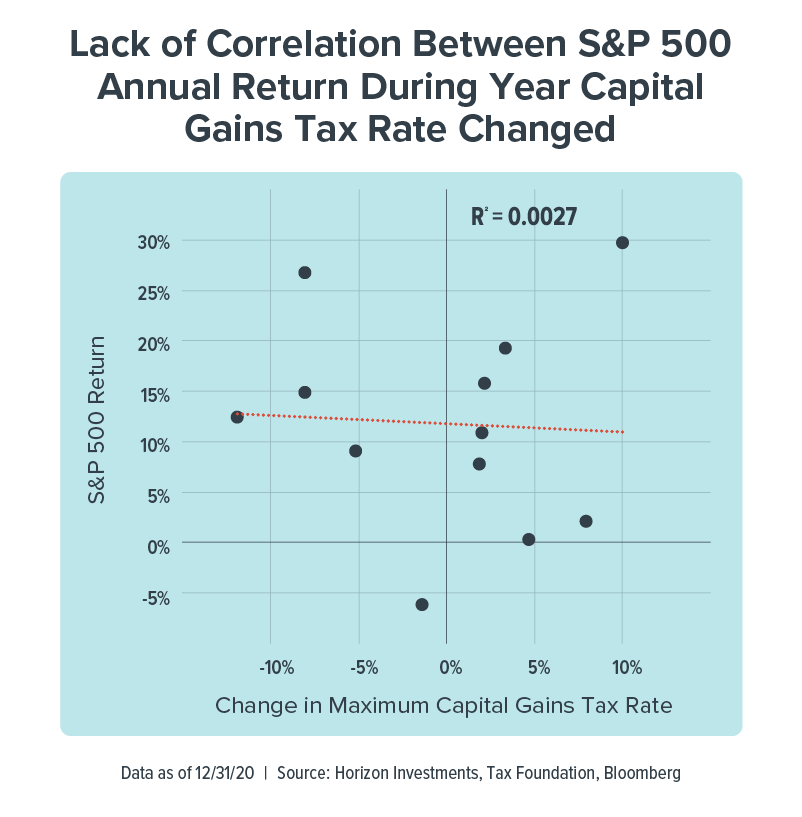
Scattershot scatterplot
Since equity investors are in the business of discounting the future, we looked at whether there was a relationship in the year before the capital gains tax rate changed.
Intuitively, one would assume investors would act ahead of a tax increase to lock in a higher after-tax value of their investments, likely redeploying that capital the following year back into stocks. On the flipside, investors would likely hold off on selling their shares ahead of a decrease in capital gains tax rate, to take advantage of lower taxes.

No matter how we looked at the data, we found essentially no relationship. In the nearby scatter plot chart for the year when the tax rate changed, the correlation value of stocks and the change in the tax rate – shown as the R2 – is close to zero. In statistical terms, a zero reading means equity returns and changes in the capital gains tax rate are strangers; the movement in one has no explanatory value for the movement of the other.
Macro trumps micro
While taxes are a very important consideration for investors, in any given year the macro conditions likely overwhelm any investor behavior spurred by changes in the capital gains tax.
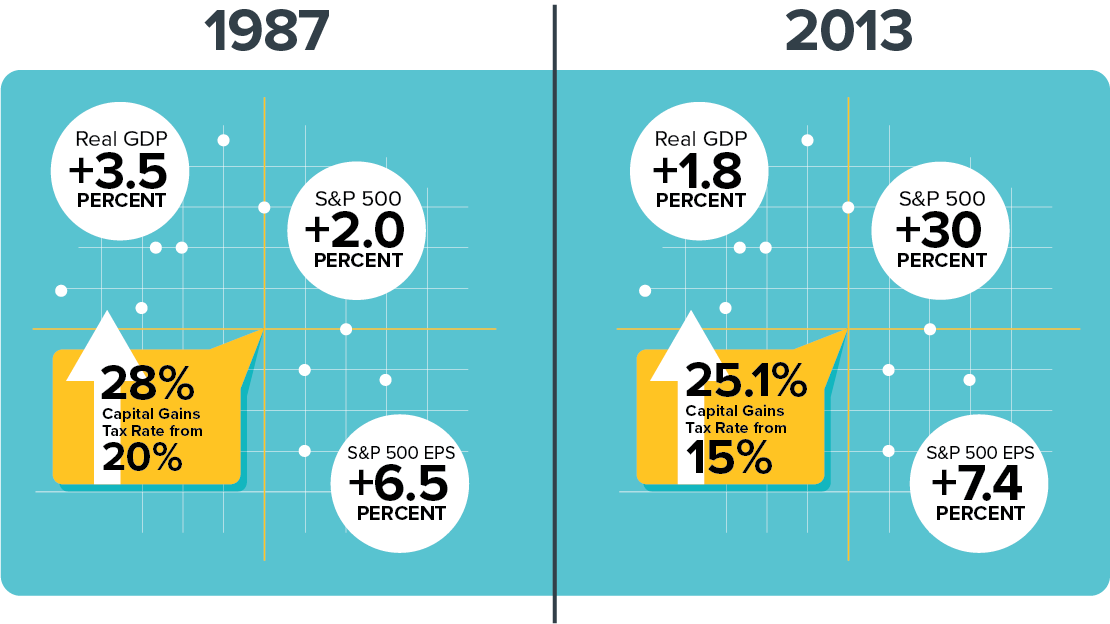
For example, in 1987 and 2013 when there were substantial increases in the top capital gains tax rate, the S&P 500 scored multiple record highs in both of those years, and posted positive annual gains – even despite the October 1987 crash (which was related to portfolio insurance, computer-driven trading and a weaker dollar, rather than tax rates).1
Valuations for equities were reasonable on a trailing price-to-earnings basis at the start of those years, earnings grew by year-end and economic growth was positive. Federal Reserve policy was stimulative going into 1987, having cut rates by 175 basis points in 1986 as inflation retreated. In 2013, the Fed kept rates at essentially zero and added economic stimulus through the buying of Treasury bonds amid a global growth scare. The favorable macro backdrop is similar to today, which could blunt the impact of the proposed tax change on the stock market.
Backdrop Historically More Important for Stocks Than Capital Gains Tax

1987: GDP, S&P 500 return and earnings growth are as of 12/31/1987. Top capital gains tax rate raised to 28% from 20%. Macro backdrop: Fed raised interest rates to 6.9% from 6.0%, reversing part of 1986’s cuts. S&P price/earnings ratio was 16.3x at start of that year
2013: GDP, S&P 500 return and earnings growth are as of 12/31/2013. Top capital gains tax rate raised to 25.1% from 15%. Macro backdrop: Fed continued bond-buying economic stimulus amid a growth slowdown, kept target rate at essentially zero. S&P price/earnings ratio 14.4x at start of that year
Source: Tax Foundation, Bloomberg
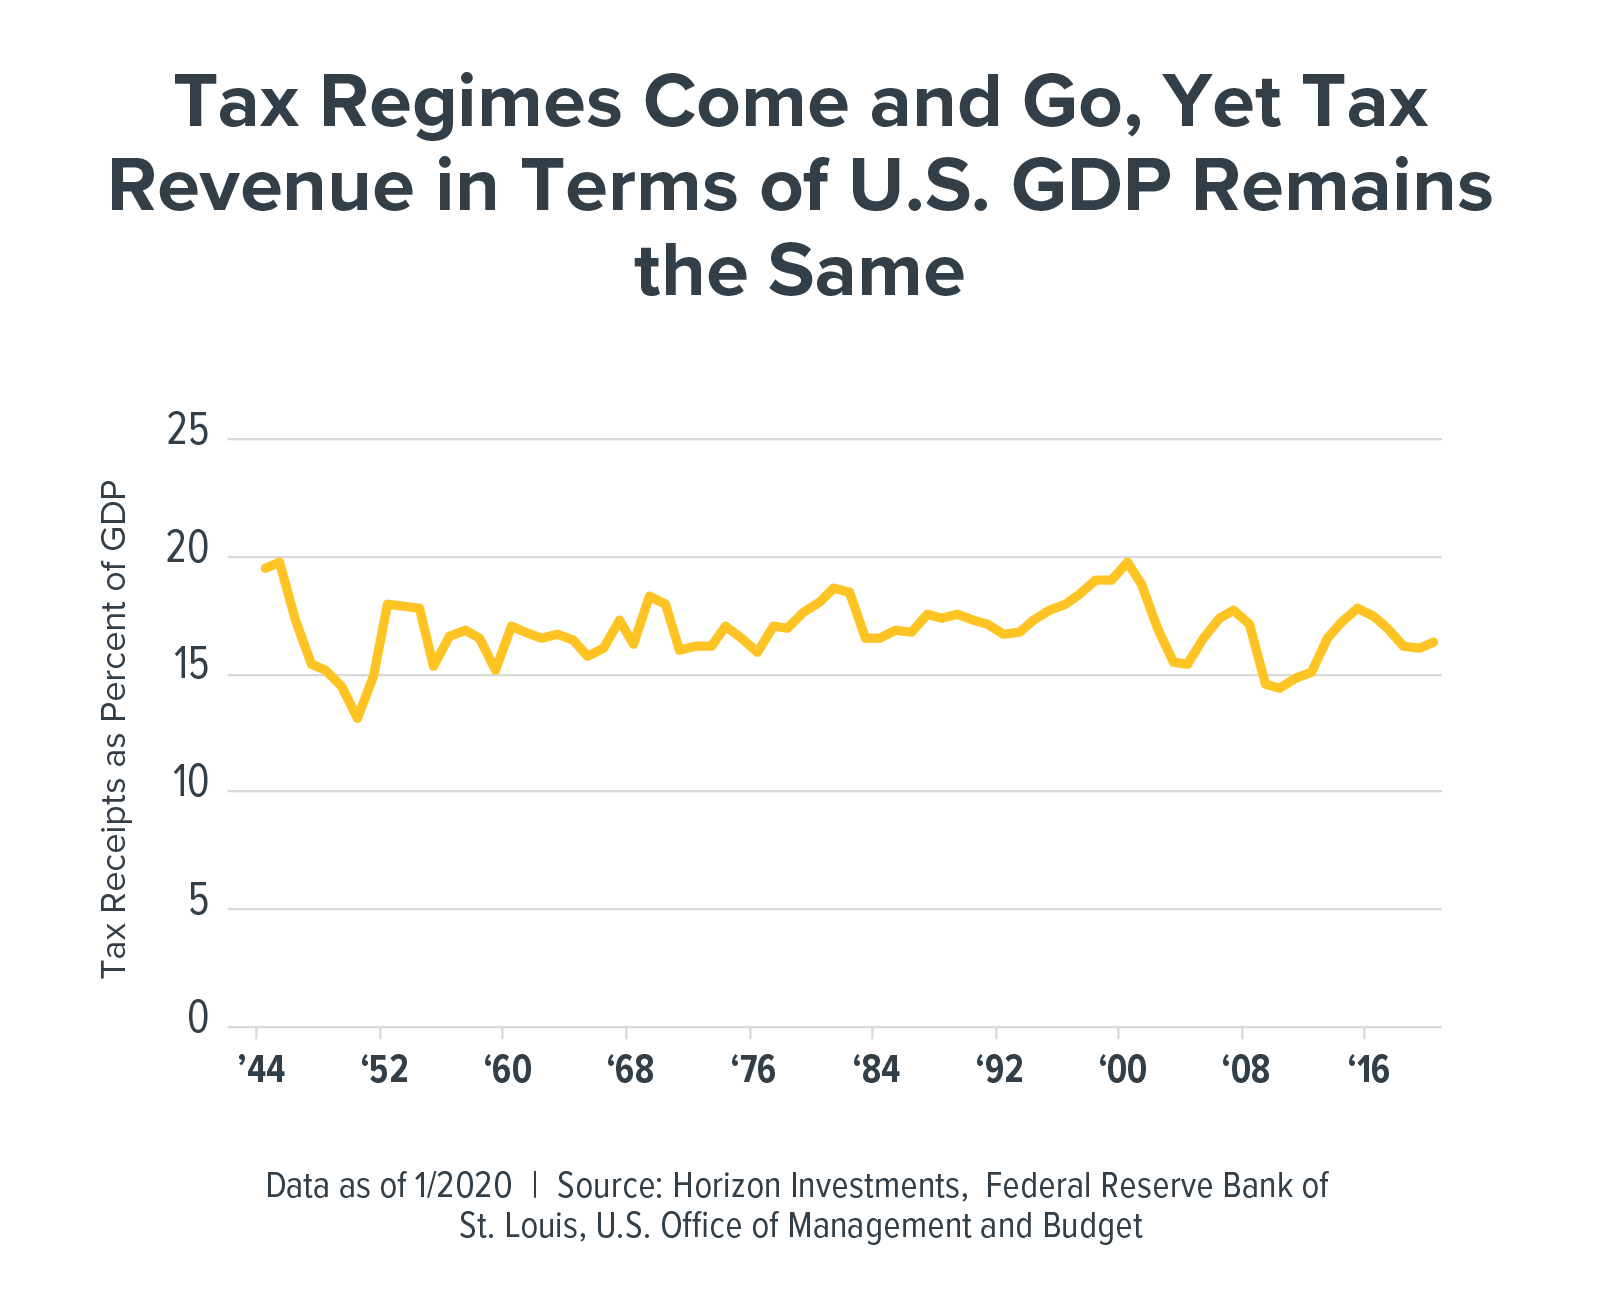
The administration’s tax proposals go well beyond capital gains, of course. And some people are worried the government may be taking too big of a bite out of the economy.
Yet what happens is that companies and individuals (and their accountants) generally attempt to manage their income and deductions to reduce their tax bill when the laws change. The result is that government tax receipts have remained constant at around 15% to 20% of GDP over the last 76 years, indicating that government stimulus, which accelerates economic growth, offsets the changes in the tax code.

Our historical analysis indicates the impact of capital gains taxes on equity returns is barely there. Indeed, that seems to still hold true. After selling off on news reports about the details of Biden’s tax plan, the S&P 500 quickly rebounded to a record high.
Stocks for the long-term
For goals-based investors, the impact of taxes should be considered. But we believe the potential for an increase in capital gains tax rates is not a good reason for investors with long-term goals to abandon the potential wealth compounding feature of equity markets.
At Horizon, we are focusing more on the transition from a government-spending led economy to one driven by the consumer, as well as the outlook for the Federal Reserve to raise interest rates, a key determinant of asset valuations. Both of those factors are currently supportive of equity markets and we think there’s little need for most investors to be concerned about a change in the capital gains tax rate.
1 https://www.investopedia.com/ask/answers/042115/what-caused-black-monday-stock-market-crash-1987.asp
Related stories:
Inflation Fixation, Bubble Trouble and Goals-Based Planning: Market Notes
Americans Retiring Early May Benefit from a Goals-Based Solution
Widows Are at Higher Risk of Falling Into Poverty
Many Investors Tried to Trade the Pandemic Plunge in Stocks
Are Bonds in a Bear Market? That’s the Wrong Question to Ask
If Inflation Returns, Bond’s Diversification Power May Disappear
Essentially Nothing. That’s How Much Bonds May Return Over Next Five Years
Only Two Words Matter to Markets: Stimulus Spending
PIIGS Fly and Other Stories of Investors Reaching for Risky Bets
Momentum’s No Longer the Stock Market King, Vaccine Will Raise New Leadership
It’s Getting Harder to Fund Retirement Using Bonds
This commentary is written by Horizon Investments’ asset management team. For additional commentary and media interviews, contact Chief Investment Officer Scott Ladner at 704-919-3602 or sladner@horizoninvestments.com.
To discuss how we can empower you please contact us at 866.371.2399 ext. 202 or info@horizoninvestments.com.
Get a print version of this commentary.
Nothing contained herein should be construed as an offer to sell or the solicitation of an offer to buy any security. This report does not attempt to examine all the facts and circumstances that may be relevant to any company, industry or security mentioned herein. We are not soliciting any action based on this document. It is for the general information of clients of Horizon Investments, LLC (“Horizon”). This document does not constitute a personal recommendation or take into account the particular investment objectives, financial situations, or needs of individual clients. Before acting on any analysis, advice or recommendation in this document, clients should consider whether the security in question is suitable for their particular circumstances and, if necessary, seek professional advice. Investors may realize losses on any investments. Index information is intended to be indicative of broad market conditions. The performance of an unmanaged index is not indicative of the performance of any particular investment. It is not possible to invest directly in an index. The visuals shown above are for illustrative purposes only and should not be considered a guarantee of success or a certain level of performance. More information about the calculations used in this article are available from Horizon Investments.
This material has been prepared for informational purposes only. Horizon Investments does not provide tax advice. Investors are strongly advised to consult with their tax advisors regarding any potential investment or specific tax questions and obligations.
Past performance is not a guide to future performance. Future returns are not guaranteed, and a loss of original capital may occur. This commentary is based on public information that we consider reliable, but we do not represent that it is accurate or complete, and it should not be relied on as such. Opinions expressed herein are our opinions as of the date of this document. These opinions may not be reflected in all of our strategies. We do not intend to and will not endeavor to update the information discussed in this document. No part of this document may be (i) copied, photocopied, or duplicated in any form by any means or (ii) redistributed without Horizon’s prior written consent.
Other disclosure information is available at www.horizoninvestments.com.
Horizon Investments and the Horizon H are registered trademarks of Horizon Investments, LLC
©2021 Horizon Investments LLC

